
Featured Apps
MediaHub
Top News
Stocktracker
Free Apps (TOP)
Free Apps (NEW)
Paid Apps (TOP)
Paid Apps (NEW)
Top Grossing Apps
Jobsearch Apps
News Apps
Business Apps
Finance Apps
HTML Open Tag Checker
Marketing URL Builder
Percentage Calculator
Inflation Calculator
Loan Interest Calculator
Roblox Robux Calculator
Kids Apps
Dating Apps
Senior Apps
Tradesman Apps
Board Game Apps
Faith Apps
Meditation Apps
AI Apps
EV Apps
Feature Your App
Casting ATL App
The Shop Channel App


SPL Graph App
Price: $ 9.99 USD - $9.99
Genre: Music
Developer: Andrew Smith Developer: Andrew Smith
Seller: Andrew Smith Seller: Andrew Smith
Rated: 3 out of 5 stars.
Based on 2 reviews.
Shop Collectibles and Memorabilia.
Price: $ 9.99 USD - $9.99
Genre: Music
Developer: Andrew Smith Developer: Andrew Smith
Seller: Andrew Smith Seller: Andrew Smith
Rated: 3 out of 5 stars.
Based on 2 reviews.
Shop Collectibles and Memorabilia.
Apple AppStore - Google Play
SPL Graph App V. 9.0
by Andrew Smith
SPL Graph is an audio Sound Pressure Level (SPL) environmental noise analyzer, real-time frequency analyzer, chart recorder and data logger. It includes: * Plot sound level over time * Record audio wh - More Info...

New Music Discovery with PlaylistDuel.com
AMAZON EBAY WALMART
BESTBUY ETSY
Huge Collectibles - Preorders Bestseller Gifts Shop Disney Collectibles
Top Gifts and Preorders Entertainment Earth SideShow Collectibles
❯ Top Gifts and Preorders.
❯ The SPL Graph App Review from the BigTopApps Team.
🌟 What makes SPL Graph so special? 🌟
SPL Graph is an audio Sound Pressure Level (SPL) environmental noise analyzer, real-time frequency analyzer, chart recorder and data logger. It includes: * Plot sound level over time * Record audio while plot is running, playback to identify sounds that may have caused problems * Capture video of events (optional in-app purchase) * Do octave and 1/...
Whether you're a seasoned pro or a newbie in the digital world, SPL Graph app is designed to make your life easier, more fun, and more productive. Here are just a few highlights:


share
🚀 Price: 9.99 USD
📈 Rating: 3 out of 5 stars. Based on 2 total reviews.
🎨 Content Rating: 4+
💡 New Features:
-Bug fixes and stability improvements
But that's not all! The Andrew Smith team is continuously improving and expanding SPL Graph to bring you even more exciting features at the palm of your hand, being last updated at 2025-12-20, the Andrew Smith team works hard to stay ahead of the curve and bring you an exceptionally robust, secure, and up-to-date app.
Download and experience SPL Graph now and unlock a new journey in your mobile world – Your mobile device will thank you.! 📱💫
Also don't miss out on future mobile app features. Join the millions who have already discovered the magic of SPL Graph and download BigTopApps Discovery App today, and never miss a new app announcement and feature release again! We are also on the web at BigTopApps.com.
Apple AppStore - Google Play
Shop Collectibles and Memorabilia.
BestBuy - WalMart - Entertainment Earth
SPL Graph App Details
Available Since: 2009-03-27
Developer: Andrew Smith
Seller: Andrew Smith
Price: 9.99 USD
Current version: 9.0
Last Updated: 2025-12-20
Ratings: 3 out of 5 stars.
Based on 2 reviews. (Rate/Review)
Genre: Music
Filesize: 21.51MB
IOS Bundle ID: com.studiosix.LEQ
Age Rating: 4+
Languages: EN, FR, DE, JA, PL, ZH, ES, SV
Videos: SPL Graph App Videos
Apple AppStore - Google Play
SPL Graph Updates and Release Notes
-Bug fixes and stability improvements
Please note BigTopApps is not responsible for the content provided by the publicly accessible App Store API.
❯ SPL Graph App Description
SPL Graph is an audio Sound Pressure Level (SPL) environmental noise analyzer, real-time frequency analyzer, chart recorder and data logger. It includes:
* Plot sound level over time
* Record audio while plot is running, playback to identify sounds that may have caused problems
* Capture video of events (optional in-app purchase)
* Do octave and 1/3 octave band analysis (optional in-app purchase)
* Show a 3D Plot of octave or 1/3 octave results
* Calculate Ln SPL values, L01, L10, L50, L90, L95, LMax and LMin
* Email notifications when sound exceeds pre-set limits
* Auto-save results after set intervals, and email the results to you
* Start another plot after auto-saving for continuous operation
SPL Graph works by averaging the SPL for a period of time that can vary from 0.1 second to 60 minutes, applying an optional weighting filter, and plotting the sound level, recording the raw audio signal, if recording is turned on.
For sound intervals of 1.0 second to 60 minutes, the optional octave and 1/3 octave logging modules allows storing the spectrum of the sound, for each interval.
The app works very well with the built-in iOS device microphone. To upgrade the app to true professional standards, add our iTestMic, iPrecisionMic, or iAudioInterface2 with an appropriate microphone, and get ANSI or ISO Type 1 or 2 results. With iPrecisionMic, you can send the system in to our calibration lab and get a calibration certificate for ISO 61672 and ANSI S1.4.
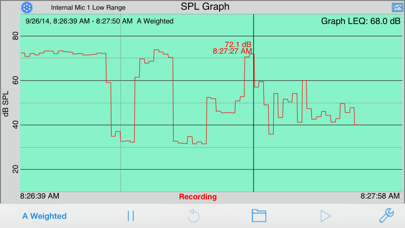
SPL Graph can record up to 24 hours of sound level data, with single second resolution. The graph starts with a one-minute plot window, and as a minute is recorded, the graph re-scales automatically and adds another minute to show the data collected so far. The overall SPL level, or LEQ, is displayed for whatever portion of the test is showing on the graph.
Tap the play button to play back the recorded audio, and you can use the cursor to scrub the audio location on the graph. Use this feature to listen to events that you can see on the graph.
With the optional octave logging module, you can also record the octave or 1/3 octave band levels. And, you can view the data on the 3D plot for a graphical view of frequency over time.
You can scroll and scale the graph vertically, in dB, by using standard swipe and pinch gestures. You can also scroll and expand and contract the time axis using gestures. Zoom out to a full 24 hours, or zoom in to a single minute, showing second resolution. Double-tap the screen to zoom out to show the entire graph on the screen.
The time scale grid changes dynamically, highlighting minutes, ten-minute, and hour lines as as it runs.
As the graph runs, the overall LEQ (average SPL) for the entire time period is computed and displayed on the screen. Swiping across the graph brings up a cursor that displays the exact dB level and time for any point on the graph.
You can turn on audio recording, so that you have a record of the sounds that were happening while the graph was being stored. You can use this to figure out exactly what the sound was that caused a peak on the graph, for example. Recordings can be compressed or uncompressed.
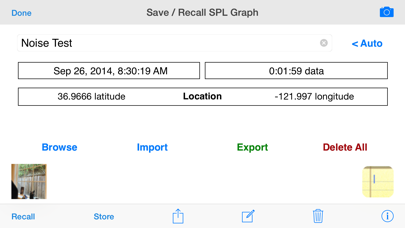
If you exit the app, or are interrupted with a phone call, the graph data will not be lost. SPL Graph will automatically save the graph, and reload it when you next open the program. You can also save a graph in one of ten files on the iPhone, so that you can recall the graph later.
SPL Graph supports saving graphs directly on your iOS device. You can recall these graphs and bring them up on the screen, and listen to the sounds that were made while the graph was recorded. You can also store an image of the screen to your photo roll. Use Dropbox or iTunes Files Sharing to export the results to your computer.
You can also export data in tab-delimited files for XLS import using iCloud.
The filters are all ANSI type 1 or better, and include A-weighting, C-weighting, and all octaves band filters from 32 to 16kHz.
* Plot sound level over time
* Record audio while plot is running, playback to identify sounds that may have caused problems
* Capture video of events (optional in-app purchase)
* Do octave and 1/3 octave band analysis (optional in-app purchase)
* Show a 3D Plot of octave or 1/3 octave results
* Calculate Ln SPL values, L01, L10, L50, L90, L95, LMax and LMin
* Email notifications when sound exceeds pre-set limits
* Auto-save results after set intervals, and email the results to you
* Start another plot after auto-saving for continuous operation
SPL Graph works by averaging the SPL for a period of time that can vary from 0.1 second to 60 minutes, applying an optional weighting filter, and plotting the sound level, recording the raw audio signal, if recording is turned on.
For sound intervals of 1.0 second to 60 minutes, the optional octave and 1/3 octave logging modules allows storing the spectrum of the sound, for each interval.
The app works very well with the built-in iOS device microphone. To upgrade the app to true professional standards, add our iTestMic, iPrecisionMic, or iAudioInterface2 with an appropriate microphone, and get ANSI or ISO Type 1 or 2 results. With iPrecisionMic, you can send the system in to our calibration lab and get a calibration certificate for ISO 61672 and ANSI S1.4.
SPL Graph can record up to 24 hours of sound level data, with single second resolution. The graph starts with a one-minute plot window, and as a minute is recorded, the graph re-scales automatically and adds another minute to show the data collected so far. The overall SPL level, or LEQ, is displayed for whatever portion of the test is showing on the graph.
Tap the play button to play back the recorded audio, and you can use the cursor to scrub the audio location on the graph. Use this feature to listen to events that you can see on the graph.
With the optional octave logging module, you can also record the octave or 1/3 octave band levels. And, you can view the data on the 3D plot for a graphical view of frequency over time.
You can scroll and scale the graph vertically, in dB, by using standard swipe and pinch gestures. You can also scroll and expand and contract the time axis using gestures. Zoom out to a full 24 hours, or zoom in to a single minute, showing second resolution. Double-tap the screen to zoom out to show the entire graph on the screen.
The time scale grid changes dynamically, highlighting minutes, ten-minute, and hour lines as as it runs.
As the graph runs, the overall LEQ (average SPL) for the entire time period is computed and displayed on the screen. Swiping across the graph brings up a cursor that displays the exact dB level and time for any point on the graph.
You can turn on audio recording, so that you have a record of the sounds that were happening while the graph was being stored. You can use this to figure out exactly what the sound was that caused a peak on the graph, for example. Recordings can be compressed or uncompressed.
If you exit the app, or are interrupted with a phone call, the graph data will not be lost. SPL Graph will automatically save the graph, and reload it when you next open the program. You can also save a graph in one of ten files on the iPhone, so that you can recall the graph later.
SPL Graph supports saving graphs directly on your iOS device. You can recall these graphs and bring them up on the screen, and listen to the sounds that were made while the graph was recorded. You can also store an image of the screen to your photo roll. Use Dropbox or iTunes Files Sharing to export the results to your computer.
You can also export data in tab-delimited files for XLS import using iCloud.
The filters are all ANSI type 1 or better, and include A-weighting, C-weighting, and all octaves band filters from 32 to 16kHz.
Apple AppStore - Google Play
Discussions, Ratings, and Reviews for SPL Graph App
Leave feedback and review SPL Graph
Featured Apps
MediaHub
Top News
Stocktracker
Free Apps (TOP)
Free Apps (NEW)
Paid Apps (TOP)
Paid Apps (NEW)
Top Grossing Apps
Jobsearch Apps
News Apps
Business Apps
Finance Apps
HTML Open Tag Checker
Marketing URL Builder
Percentage Calculator
Inflation Calculator
Loan Interest Calculator
Roblox Robux Calculator
Kids Apps
Dating Apps
Senior Apps
Tradesman Apps
Board Game Apps
Faith Apps
Meditation Apps
AI Apps
EV Apps
Feature Your App
Casting ATL App
The Shop Channel App
Featured: Business Solutions
Top Free Apps

ChatGPT - OpenAI OpCo, LLC
1
Introducing ChatGPT for iOS: OpenAI’s latest advancements at your fingertips.
This official app is free, syncs your history across devices, and brings you the latest from OpenAI, includi...

Threads - Instagram, Inc.
2
Say more with Threads — Instagram’s text-based conversation app.
Threads is where communities come together to discuss everything from the topics you care about today to what’ll be trend...

Paramount+ - CBS Interactive
3
Stream exclusive originals, hit movies, live sports like NFL on CBS and UEFA Champions League, all of SHOWTIME® (Premium plan only), and favorites from CBS, Nickelodeon, Comedy Central, B...

UpScrolled - RECURSIVE METHODS PTY LTD
4
UpScrolled — Where voices connect, stories unfold, and expression thrives.
Built for authentic connection and genuine expression. Unlike mainstream platforms, UpScrolled prioritizes real...

Google Gemini - Google
5
Google Gemini app is your personal, proactive and powerful AI Assistant.
With Gemini on your iPhone or iPad, you can:
- Enjoy fast and unlimited prompting powered by our biggest upgrade...

Temu: Shop Like a Billionaire - Temu
6
Shop on Temu for exclusive offers.
No matter what you're looking for, Temu has you covered, including fashion, home decor, handmade crafts, beauty & cosmetics, clothing, shoes, and more...
Top Paid Apps

Minecraft: Dream it, Build it! - Mojang
1
Dive into an open world of building, crafting and survival. Gather resources, survive the night, and build whatever you can imagine one block at a time. Explore and craft your way through...

Geometry Dash - RobTop Games AB
2
Jump and fly your way through danger in this rhythm-based action platformer!
"Frustratingly wonderful" - Kotaku
"Geometry Dash provides all of the challenge expected from an “impossibl...

Heads Up! - Warner Bros.
3
It's the game The New York Times called a "Sensation!" and Cosmopolitan raved “Your existence is dull and meaningless without this life-changing app!”
Get ready for endless fun with Head...

Plague Inc. - Ndemic Creations
4
Can you infect the world? Plague Inc. is a unique mix of high strategy and terrifyingly realistic simulation.
Your pathogen has just infected 'Patient Zero'. Now you must bring about th...

MONOPOLY: The Board Game - Marmalade Game Studio
5
Play MONOPOLY on the go without distractions – no ads, no fuss!
Challenge friends, family and fans from around the globe in the digital version of the official MONOPOLY board game, lice...

Bloons TD 6 - Ninja Kiwi
6
Craft your perfect defense from a combination of powerful Monkey Towers and awesome Heroes, then pop every last invading Bloon!
Over a decade of tower defense pedigree and regular massiv...
Top Grossing Apps
ChatGPT - OpenAI OpCo, LLC
1
Introducing ChatGPT for iOS: OpenAI’s latest advancements at your fingertips.
This official app is free, syncs your history across devices, and brings you the latest from OpenAI, includi...
YouTube - Google
2
Get the official YouTube app on iPhones and iPads. See what the world is watching -- from the hottest music videos to what’s popular in gaming, fashion, beauty, news, learning and more. S...

MONOPOLY GO! - Scopely, Inc.
3
The wizarding world awaits! Hit GO! Roll the dice with the witches and wizards of Harry Potter! Earn MONOPOLY money, interact with your friends, family members and fellow Tycoons from aro...

TikTok - Videos, Shop & LIVE - TikTok Ltd.
4
TikTok is THE destination for mobile videos. On TikTok, short-form videos are exciting, spontaneous, and genuine. Whether you’re a sports fanatic, a pet enthusiast, or just looking for a ...
Paramount+ - CBS Interactive
5
Stream exclusive originals, hit movies, live sports like NFL on CBS and UEFA Champions League, all of SHOWTIME® (Premium plan only), and favorites from CBS, Nickelodeon, Comedy Central, B...

Royal Match - Dream Games
6
King Robert needs your help to restore Royal Castle’s former glory. Break the obstacles and combine amazing power-ups to beat joyful and challenging levels! Keep unlocking wonderful areas...
New Free Applications


BIGTOPAPPS
Contact US for Reviews.
THESHOPCHANNEL APP - Best Shopping Deals, Coupons, and Savings!
Mini Games Studio on iOS and Android.
Casting ATL, FREE on iOS and Google Play Store!
Apple TV MLS Season Pass Apple TV + Apple Music Free 3 Months
New Paid Applications


© 2026 BigTopApps -
Privacy Policy - Troubleshooting Guide - Directory - Contact Us
LiveDataLink Development.
Please note BigTopApps is not responsible for the content provided by the publicly accessible App Store API.
The BigTopApps, BigTopApps.com, and all connected websites, social media platforms, and media outlets are part of a professional website network.
Please note that we may receive compensation from various entities whose products and services we review, promote, and/or endorse.
We are independently owned and the opinions expressed here are our own, except where indicated.